


Unveiling Bundaberg's Housing Market: The Best & Worst Suburbs in terms of House Median Price Growth over the last 12 Months.
At First National Bundaberg, we've compiled the definitive list of both the top-performing and underperforming suburbs over the past 12 months. Prepare to be astonished by the surprising insights gleaned from our data!
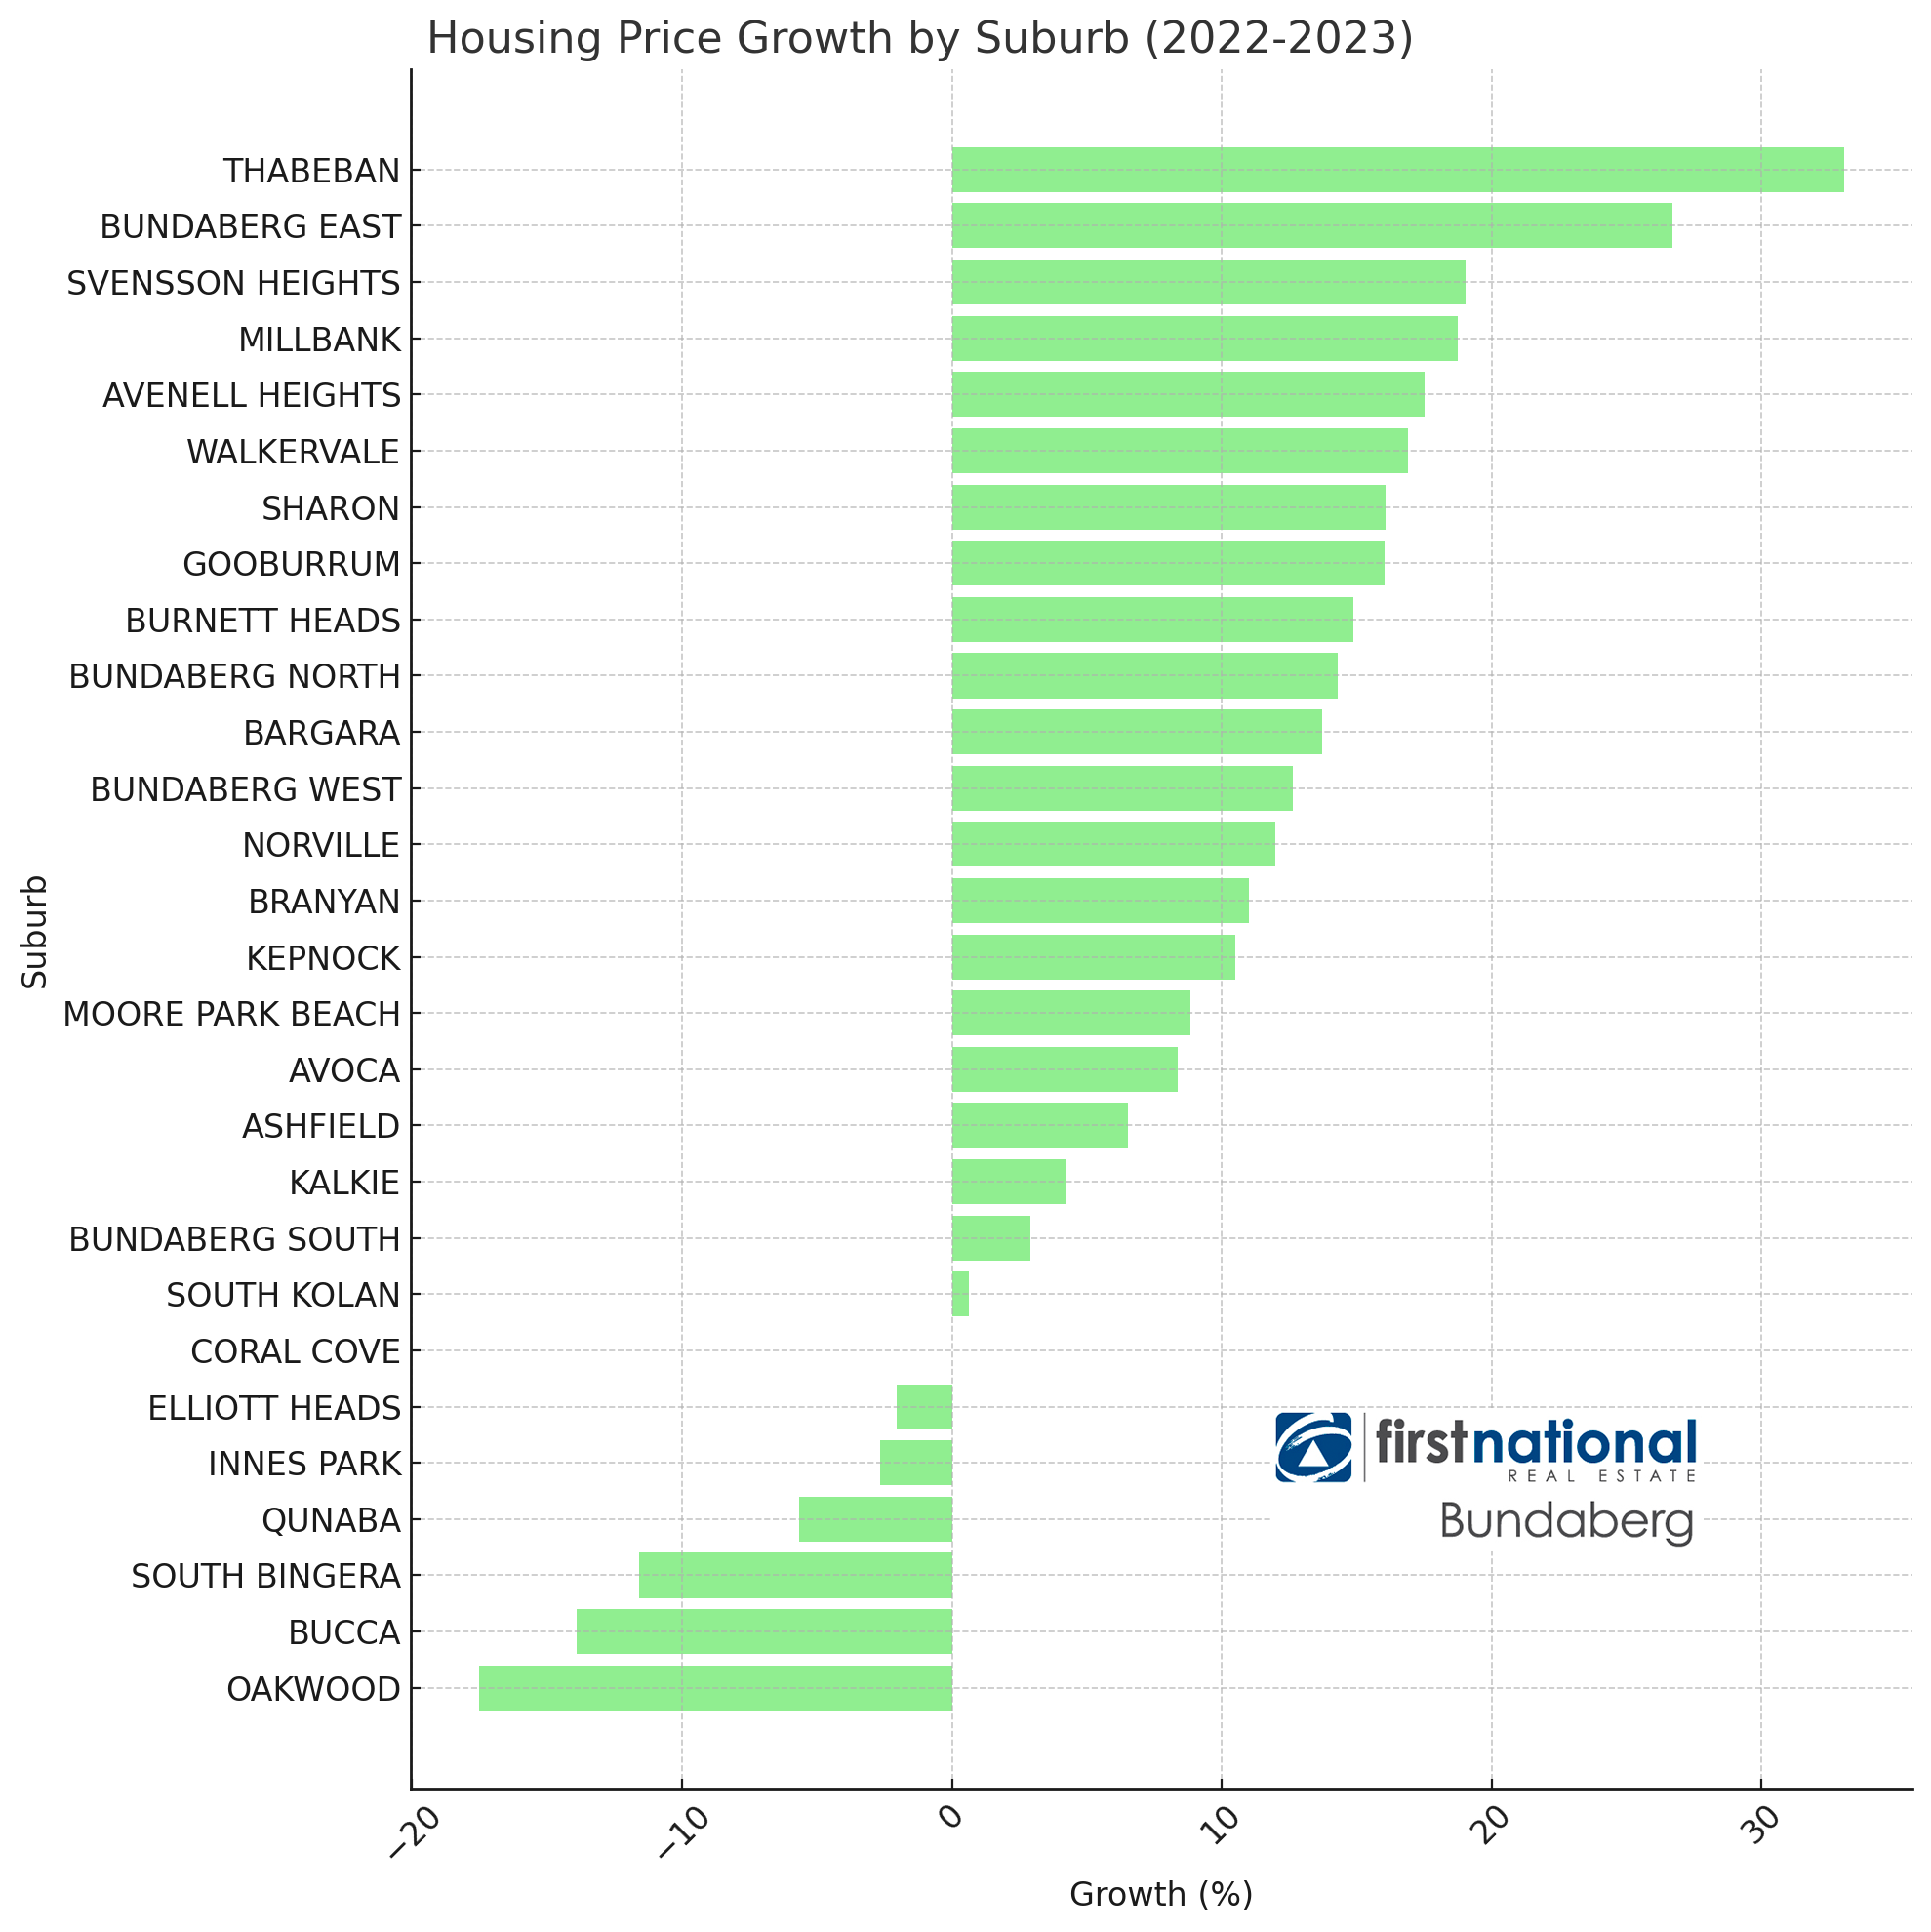
House Median Price Changes from December 2022 to December 2023
1. Thabeban: $360,000 (2022) → $479,000 (2023)
2. Bundaberg East: $341,000 (2022) → $432,000 (2023)
3. Svensson Heights: $365,500 (2022) → $435,000 (2023)
4. Millbank: $360,000 (2022) → $427,500 (2023)
5. Avenell Heights: $392,254 (2022) → $461,000 (2023)
6. Walkervale: $340,000 (2022) → $397,500 (2023)
7. Sharon: $560,000 (2022) → $650,000 (2023)
8. Gooburrum: $640,000 (2022) → $742,500 (2023)
9. Burnett Heads: $487,500 (2022) → $560,000 (2023)
10. Bundaberg North: $350,000 (2022) → $400,000 (2023)
11. Bargara: $620,000 (2022) → $705,000 (2023)
12. Bundaberg West: $380,000 (2022) → $428,000 (2023)
13. Norville: $375,000 (2022) → $420,000 (2023)
14. Branyan: $500,000 (2022) → $555,000 (2023)
15. Kepnock: $407,290 (2022) → $450,000 (2023)
16. Moore Park Beach: $510,000 (2022) → $555,000 (2023)
17. Avoca: $448,500 (2022) → $486,000 (2023)
18. Ashfield: $621,000 (2022) → $661,500 (2023)
19. Kalkie: $499,000 (2022) → $520,000 (2023)
20. Bundaberg South: $345,000 (2022) → $355,000 (2023)
21. South Kolan: $485,000 (2022) → $488,000 (2023)
22. Coral Cove: $730,000 (2022) → $730,000 (2023)
23. Elliott Heads: $602,250 (2022) → $590,000 (2023)
24. Innes Park: $750,000 (2022) → $730,000 (2023)
25. Qunaba: $575,000 (2022) → $542,500 (2023)
26. South Bingera: $522,500 (2022) → $462,000 (2023)
27. Bucca: $630,000 (2022) → $542,500 (2023)
28. Oakwood: $542,500 (2022) → $447,500 (2023)
Best Performing Suburbs for Median Price Growth from December 2022 to December 2023
Best Performing
1. Thabeban: 33.06% increase
2. Bundaberg East: 26.69% increase
3. Svensson Heights: 19.02% increase
4. Millbank: 18.75% increase
5. Avenell Heights: 17.53% increase
6. Walkervale: 16.91% increase
7. Sharon: 16.07% increase
8. Gooburrum: 16.02% increase
9. Burnett Heads: 14.87% increase
10. Bundaberg North: 14.29% increase
11. Bargara: 13.71% increase
12. Bundaberg West: 12.63% increase
13. Norville: 12.0% increase
14. Branyan: 11.0% increase
15. Kepnock: 10.49% increase
17. Moore Park Beach: 8.82% increase
17. Avoca: 8.36% increase
18. Ashfield: 6.52% increase
19. Kalkie: 4.21% increase
20. Bundaberg South: 2.9% increase
21. South Kolan: 0.62% increase
Static Growth
22. Coral Cove: 0.0% increase
Worst Performing (Decrease in Values)
23. Elliott Heads: -2.03% decrease
24. Innes Park: -2.67% decrease
25. Qunaba: -5.65% decrease
26. South Bingera: -11.58% decrease
27. Bucca: -13.89% decrease
28. Oakwood: -17.51% decrease
Takeaways
Thabeban
Thabeban stands out with its remarkable 33% increase, highlighting its previous undervaluation relative to other Bundaberg suburbs. Positioned similarly to other sought-after areas within Bundaberg City, Thabeban boasts advantageous location benefits and enjoys the distinction of being one of the few flood-free suburbs in the region. Consequently, property prices in Thabeban have swiftly ascended to align with its counterparts, shedding its former status as a locale of discounted rates.
After growth on the coast? Burnett Heads, Bargara and Moore Park Beach are the places to be!
It's unexpected to note that not every Bundaberg Coastal suburb has witnessed a surge in property prices. Surprisingly, Elliott Heads and Innes Park have both experienced a decline in property values during this period, while Coral Cove has remained relatively stagnant.
Honourable Mentions
Bundaberg East
Bundaberg East has seen remarkable growth during this period, fueled by its excellent location and diverse range of dining options. Being the closest inner-city suburb to Bargara, it's not surprising that Bundaberg East has claimed the second spot in terms of median home price growth over the last 12 months.
Prepared by First National Real Estate Bundaberg. © Property Data Solutions Pty Ltd 2024 (pricefinder.com.au)
The materials are provided as an information source only. © The State of Queensland (Department of Natural Resources, Mines and Energy) February/2024. Based on or contains data provided by the State of Queensland (Department of Natural Resources, Mines and Energy) 2024. In consideration of the State permitting use of this data you acknowledge and agree that the State gives no warranty in relation to the data (including accuracy, reliability, completeness, currency or suitability) and accepts no liability (including without limitation, liability in negligence) for any loss, damage or costs (including consequential damage) relating to any use of the data. Data must not be used for direct marketing or be used in breach of the privacy laws; more information at www.propertydatacodeofconduct.com.au.